Tuesday, January 31, 2017

Years To Financial Independence

Came across this article recently in our local Business Times.

I purposely posted this in Social Media stating that if you are only able to save 10% of your income and put them all in the bank, you can retire in about 460 years.

I do not know what people who "like" the posts think.

Do they think this article is funny, the truth, or it's a joke?

The financially savvy will know this is true, the non-believers will be skeptical.

...

Is this really accurate? I'll prove it.


Notice in this chart that we're referring to Financial Independence (FI) - which is different from Retirement. Being FI means having enough assets to generate enough income for your current standard of living.

Really? I can attain FI in 10 years if I save 50% of my income and invest them at 7%?

How is that even possible?

I'll do a back of the envelop calculation here:

To make things simple, assume you earn $2K a year and spend $1K a year.

In 10 years, you'll save $10K. Compounded over 10 years, this $10K will grow to roughly $14K.

From that point forward, you can stop working: 7% of $14K generates about $1K of passive income (i.e your yearly expense)

---

It doesn't matter whether you earn $20K and spend $10K, or earn $1 Million and spend $500K. The math is all the same. The only thing that matters is your saving rate and yield.

This is, of course, assuming your expense remains the same.

Which is why I said FI = Current Standard of Living.

---

An interesting case:

Assuming we save 20% of our pay (e.g we actually save 37%, but let's assume 17% of it is use to pay for house), at the rate of 4% (roughly what the CPF retirement account pay), guess how long you need to retire?

Consult the chart, it's 40 years. Pretty accurate.

---

I think this chart brings "fear" and "relief" at the same time:

Fear because it shows how you'll never achieve FI if you have a pathetic saving rate and yield.

Relief because it shows how quickly you can achieve FI with the right strategy.

If you decide to involve yourself in the race to "haolian", to show off on social media, to chase after other people's lifestyle, then you deserve the mental stress and debts.

Buying and maintaining a car adds 10 years to your retirement for the average person. Ask yourself if it's worth it.

Do you want to forever be a slave to your own greed?


Word of advice from the Oracle of Omaha:


---

That said, don't ever save at the expense of denying yourself a comfortable life. I believe in accumulating wealth through saving, not scrimping. Eating dirt cheap, no nutrition stuff is a classic case of penny wise pound foolish - but that's story for another time.

Monday, January 16, 2017

How To Be Rich, Happy And Save The World

My most respected financial blogger from outside Singapore.

He spoke for the first time recently and delivered a presentation listing all the important stuffs you have to know if you want to learn about the mindset on the path to financial independence.

It is a path less traveled, a path most of us don't know about (and stigmatized). We are brainwashed by massive consumerism nowadays, thinking that we always need to buy more stuffs, that we need to work for 40 years or more to reach retirement.

The fact is, most of us can achieve FI in much less time than most people think. And you don't even have to give up that much.

  
WDS 2016: Pete Adeney from Chris Guillebeau on Vimeo.


---------------------------------------------------------------------------------------------------------------------

This coincides with a recent post from AK's blog.

Do you believe you need to be a high-income earner to achieve FI?

The fact is it is not that tough for most people to do so - especially in Singapore, as long as you aren't in financial distress or extreme low income group.

Do you know nearly half the world population live on $2.50 a day?
(compare this to us spending $6 on a cup of coffee)
Do you know that a networth of about $70KUSD is enough to put you at the top 10% of the world's richest?

The fact is, most of us just don't want to put in the effort.

We save up for a year only to splurge it on expensive vacations (or worst, take a loan). If you live this way year after year, there's no way you can afford to stop working.

"Spend all the money we make, we will always be poor. Borrow money to fund our lifestyle, we will be poorer than poor".

Friday, January 06, 2017

Year In Review 2016 - Annual Financial Report

Presenting 2016 Annual Financial Report!

Note From CEO

It has been a year of ups and downs. We moved to a new revenue source (hopefully with better prospects), realized significant capital gains and held on through the unpredictability of the market.

Important highlights:

- We achieved record earnings, and our net asset value grew by over 33%.
- Our overall saving rate of the year stood at 78.2%.
- Our safety passive income now covers 28% of our expenses.
- Our XIRR for 2016 is 15.6%, the first positive year since inception.
- We generated over $3000 (approximately $250 per month) worth of dividends in 2016.

For more details, please refer to specific section of the report.

*All figures exclude CPF and investment capital gains/losses.

-------------------------------------------------------------------------------------------------------------------------

Comparison With Previous Year

Expenses overall was 16% higher compared to previous year, with the most significant expenses being:
- One Time Loss, Samsung Galaxy S7, Mayday Concert in Q2
- Parent Gift in Q3.
- Braun Shaver (9 Series) and Medical Consultation in Q4


Income was 14.1% higher than the previous year, arising from:
- Record bonus in Q1.
- Structural revamp (leave encashment and pro-rated bonus) in Q4.
- Overall higher income throughout the year.


-------------------------------------------------------------------------------------------------------------------------

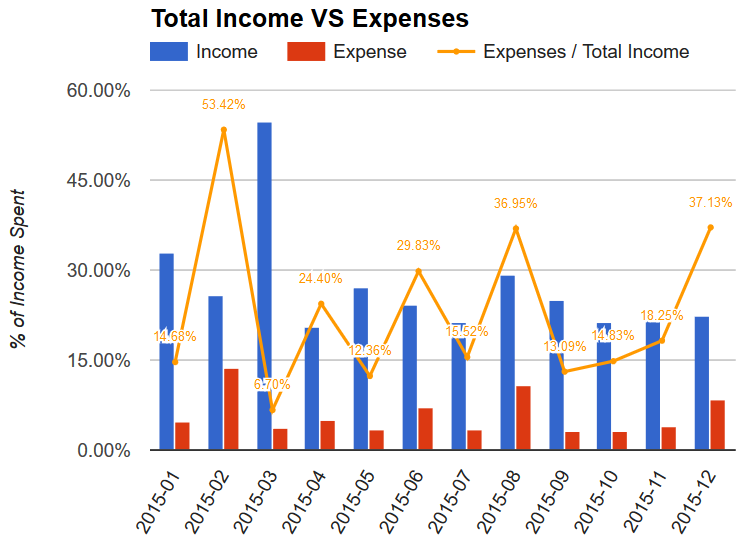
Total Income VS Total Expenses

Expense were stable except for the month of May (one-time loss).

For the whole year, our expense as percentage of income stood at 21.8% (Comparable with 21.4% in 2015). In other words, we have a saving rate of about 78%.

We achieved a record operating income and hence profit for the year (highest ever), and we do not expect to duplicate this performance anytime soon (at least not for 2017).

-------------------------------------------------------------------------------------------------------------------------

Passive Income VS Recurring Expenses

This section strips out the "noise" and highlight only the recurring portion of expenses against passive income.

It removes 3 main categories of expenses as compared to above:
1. Special - Major Items (mostly any non-essentials above $200, but not all), Gifts
2. Vacation - Any overseas trip
3. Tax - You do not get tax on capital gains/dividends in Singapore

It includes only the following form of income:
1. Dividends (Listed and Unlisted)
2. Regular Bank Interests (except special 1-time promotions)

And excludes all the following form of income:
1. Salary
2. Gambling
3. Angbao
4. Rebates - Any form of credit card or purchase rebates
5. Sale of any items
6. Rewards - Such as IPPT, RT payments, etc...

To be honest, I'm freaking amazed by the results. I'm doing much better than I imagined, and I would never have known if it weren't for all the effort put into tracking them.

There were 2 months (May and August, traditionally the 2 strongest dividend months) where my passive income exceeded my recurring expenses.

For Year 2016, my passive income is now sufficient to cover just over 56% of my recurring expenses (compared to 50% in 2015). Adding in the "double safety margin" criteria, it can cover 28% of my expenses.


-------------------------------------------------------------------------------------------------------------------------

Recurring Expenses Breakdown

As always, my top expenses are food, personal (clothing, self consumables), travel (transport) and utilities (internet and phone).

Some random discoveries:

1. I visited an "alcoholic outlet" and purchased a beverage only twice this year.

2. I brought 31 cups of Bubble Tea (i.e Koi, Gong Cha) 31 times this entire year, which costs me $106.50 in total.

3. I brought 23 cups of Cafe drinks (i.e Starbucks, Coffee Bean) this year, and each cup averages $4.80 (I usually only drink when there's 1 for 1 deal).

4. I ate fast food (counting lunch, dinner, supper) 81 times this year (!!!). To be frank, this figure is a bit higher than I thought and is not very healthy. Hopefully I can cut it down to perhaps 60 times or less.

5. I visited a restaurant 32 times this year (That's about 2 or 3 times a month, lower than most youngsters these day I believe). Each restaurant trip averaged $20.10.

6. I visited the KTV only 8 times (less than once a month) this year, each trip averaging $21. I should go to Neway more often.

-------------------------------------------------------------------------------------------------------------------------

Our portfolio is up 18% while STI is up roughly 3.5%. Since IPO, our portfolio is at a breakeven status while STI is down about 8%.

A majority of our returns this year came from the privatization of China Merchant Pacific (CMP)/Super Group and sale of ST Engineering. On the other hand, we suffered the most losses from the "collapse" of M1 (with confirmation of 4th Telco).


In terms of acquisitions, we added Frasers Centrepoint Ltd in Q3 and Singapore Telecommunications in Q4 - both which are long-term dividend holdings we are very confident of.

For the entire year, the portfolio generated just over $3000 of dividends, $600 higher than last year (lower than expected). This was largely due to the events above: In exchange for capital gains, we lost the 2 dividend cash cows of CMP and ST Engineering (both listed and unlisted holdings).

As of now, we still hold the majority of our assets in Cash. Our equities portfolio remains healthy and diversified, with top holdings being FCL, FCT, Singtel and STI.

-------------------------------------------------------------------------------------------------------------------------

Outlook For 2017

We will continue our strategy to build a sustainable and diversified dividend portfolio in 2017. With news of 3 rate hikes incoming, there will be plenty of opportunities to pick up bargains in the market.

As the company is holding a large proportion of cash, we intend to deploy them as soon as reasonable (projected 3 bullets in the first half of the year) to meet the dividend targets for next year.

Financial Goals For 2017

Attain $5000 worth of dividends (depending on state of market) 
- Increase STI as a core holding to 25% of our portfolio for stability and defensiveness.
- Explore other forms of investments (Robo) and perhaps Singapore Saving Bonds.

Sunday, January 01, 2017

Letter To Shareholders (5) - Performance Review 2016Q4

Welcome to the 5th issue of ZZ Holdings Shareholders Letter.

Performance Highlights
Once again, Mr Market proves its unpredictability with the 'Trump Rally' after the US elections. After the rollcoaster ride, STI ended the year flat at 2.94, with dividends being the sole returns (about 3.5% depending on cost).

Our portfolio dipped slightly in Q4 but is still up over 18% for the year. After 2 years of investments, we are at an almost break-even point.

In the 4th quarter, we paid out dividends of nearly $400 (base on pay-date), comparable to the previous year.

Operating Highlights
Income for the quarter were roughly 30% higher compared to last year mainly due to 2 factors:
- Conversion of nearly 1 month of leave in November.
- Higher income and pro-rated bonus in December.

These retained earnings will offset the expected big drop in earnings in March (we expect around ~60% drop).

Expenses were about 25% higher compared to last year due to several major purchases:
- Wedding
- Western Digital HDD
- Braun 9 Series

Other notable expenses include farewell gifts, some pretty expensive games (civilization 6 and plague inc) and medical trips.
Acquisitions
We added Singtel at $3.68 - a value we believe is quite fair and attractive. Singtel is a very diversified company (in terms of business areas and geographically) and derive the majority of its mobile revenue from overseas. The impact of the 4th Telco would hence be much lower.

We believe it would have no problem maintaining its 1.75c yearly dividend (20+ year track record, a mere ~60% payout ratio), representing a very stable and secure 4.8% yield.

Major Structural Change Complete
We are pleased to announce that smooth transition in the handing over.

There will be a one-time impact in March earnings next year, but we estimate comparable earnings for the whole year (depending on contract renewal). The change is definitely beneficial for the long-run.

Financial Status
1-Month SIBOR Rate is once again rising and currently stands at over 0.7%. Combined with Step-up interest, Maxigain now provides a risk-free interest of around 1.4%.

For now, we will keep a lookout for any Chinese New Year fixed deposit promotions in January, failing which we might transfer more funds into Maxigain.

We eagerly anticipate the launch of Smartly in 2017 (delayed numerous times), which is now believe to be in the final phases of approval.

Outlook
Details in the Annual Report.